| Statistics Utility |
|
Use these tools to generate graphs representing our productivity.
Set the starting and ending dates and click Submit Query button. Results will load in a new window. |
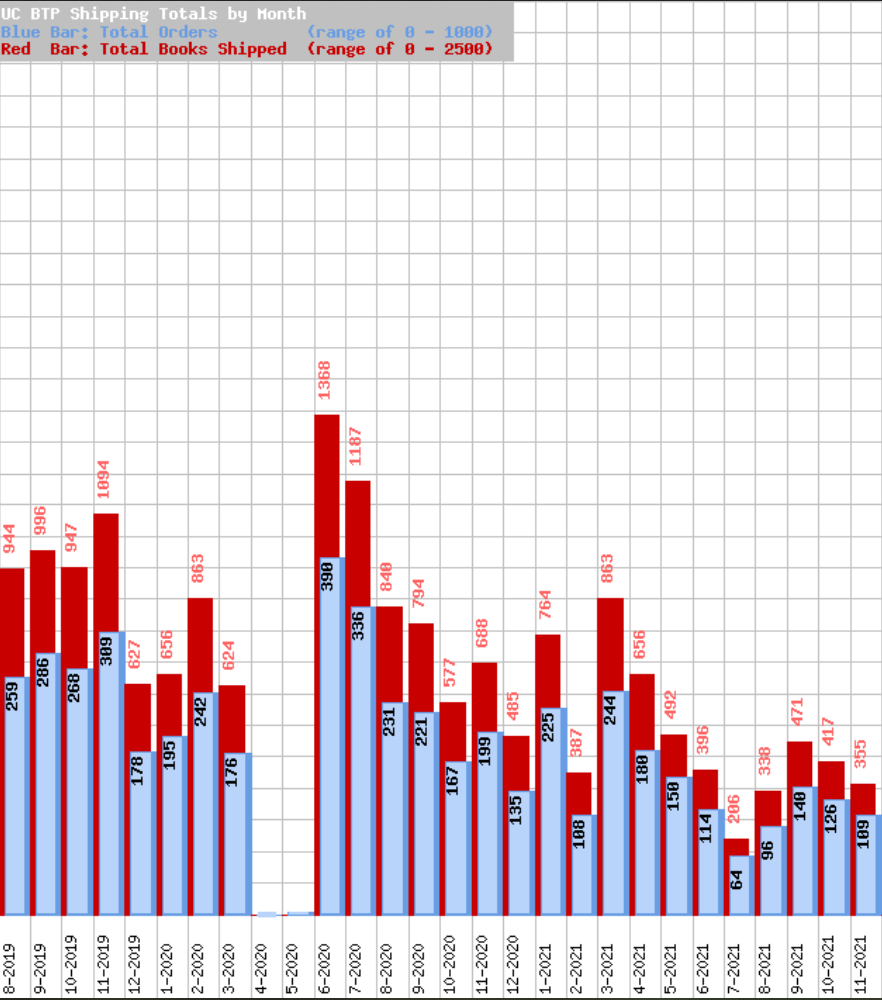
Orders Shipped
(Orders vs. Books) |
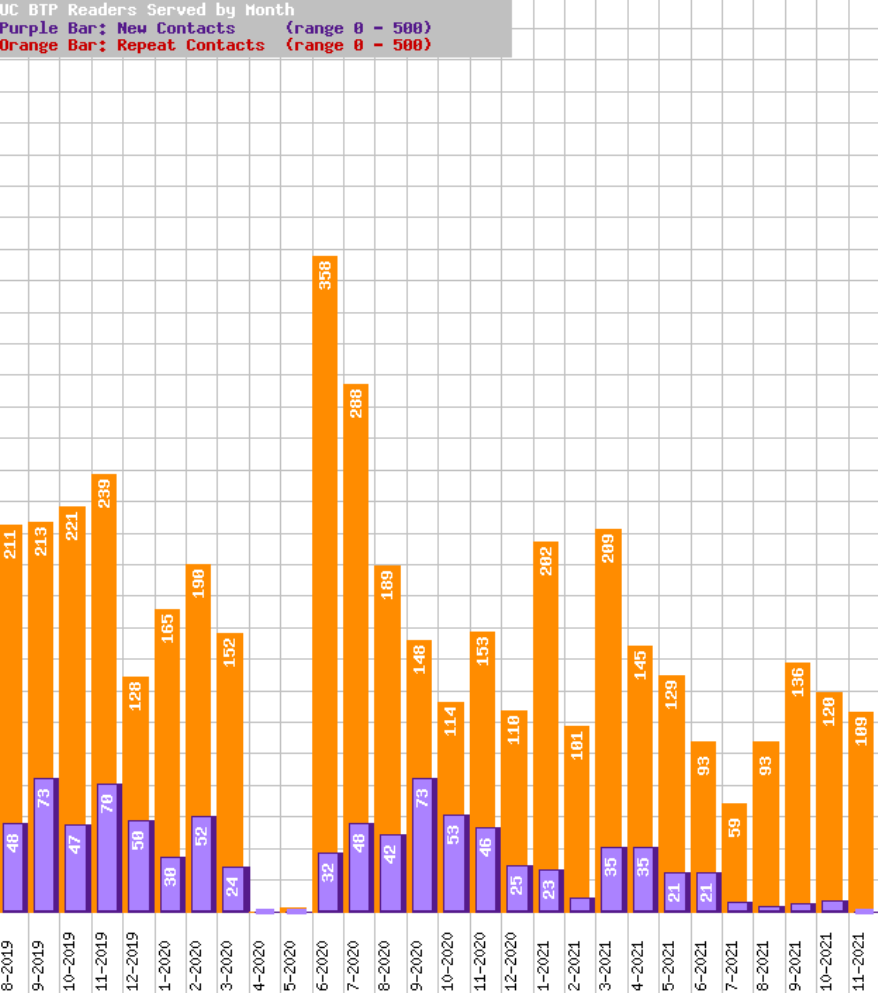
Readers Served
(New vs. Repeat contacts) |
|
|
|
|
| |
|
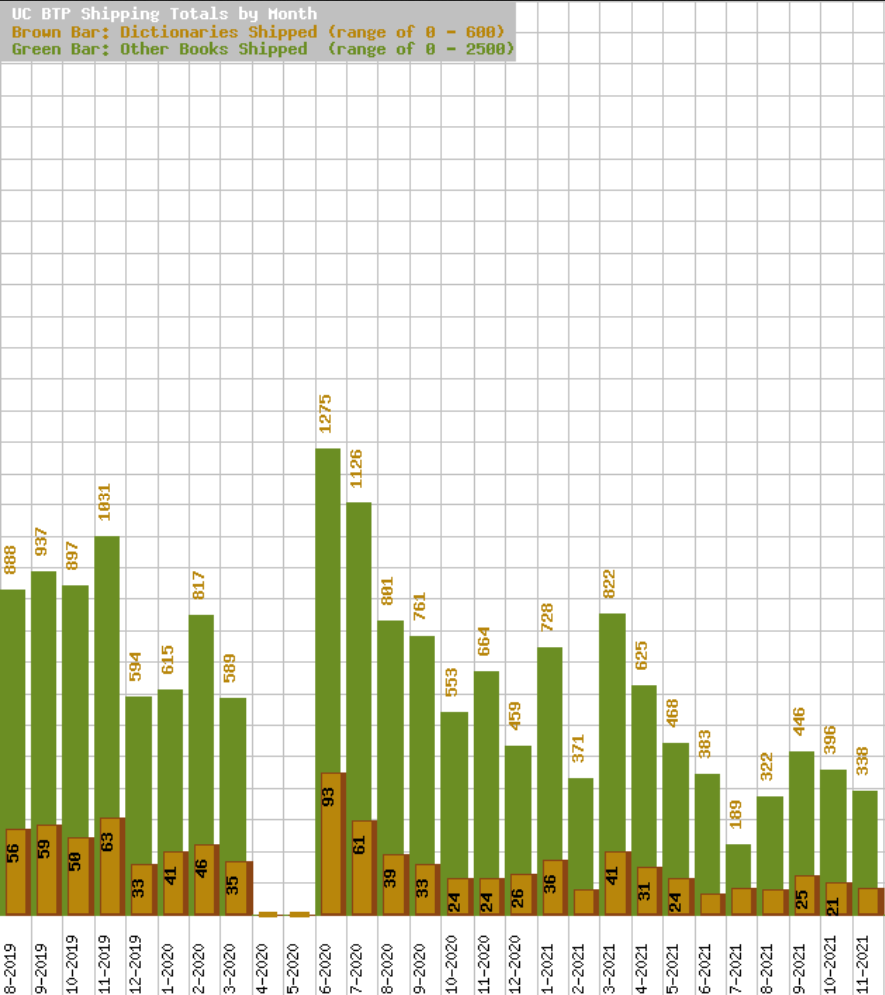
Dictionaries Shipped
(Dictionaries vs. All Other Books) |
|
|
|
|
|
|